Austin R. Dulaney, Kelsea E. Keenan, Dennis Yu, and Shaurjo Biswas
Introduction
The electrification of our future is dependent on the efficient and cost-effective manufacturing of Li-ion batteries (LIBs) in order to keep up with modern energy demands. Battery cell production is expected to grow over 20% annually to meet these demands, exceeding over 4,000 GWh/yr by 2030.1–3 Over the past decade, the cost of LIB packs have dropped by over 89%, largely due to more advanced cell designs, economies of scale, and automation.1 However, LIBs are still too expensive to encourage broad adoption of electric vehicles (EVs) and renewable energy storage systems (ESS). Manufacturing costs are one of the key factors driving the cost of cells. Rapidly scaling new cell factories is a non-trivial task, especially to reach the prices required for EVs. In 2021, process inefficiencies accounted for $8B of cost for manufacturers,4 and with raw material prices on the rise,2 there needs to be a larger emphasis on process reliability and efficiency in order to drive cell prices down.5
Electrolyte Fill and Soak in Cell Manufacturing
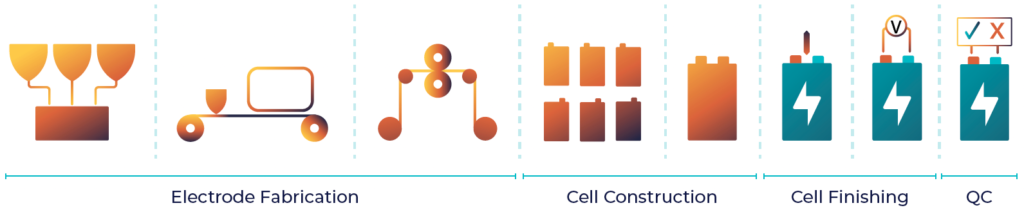
Manufacturing LIBs is a complex and resource intensive process with multiple potential failure points throughout cell production (see Fig. 2). Cell finishing—the collection of processing steps that occur post cell construction—is a key area that would benefit greatly from advanced process inspection and control methods in order to improve reliability and efficiency, as it is ubiquitous in battery manufacturing regardless of specific chemistry or cell form factor. Efficient, reliable production of high-quality cells for EV applications requires that each step of cell finishing (electrolyte fill and soak, formation, and aging) be well monitored and controlled.6 This leads to an inherent challenge, as electrolyte fill and soak is performed blindly with no standard method to track progress or quality before a cell begins formation.
There are many factors that impact the rate and quality of electrolyte saturation including the cell stack and its housing, the methods and equipment used in the filling and soaking procedures, and the environment in which this process occurs (see Fig. 3). These factors can be broken up generally into two groups related to either the product or the process. Product related factors are typically more rigidly defined and are unlikely change much once in production. For example, an OEM will have a clear definition for their cell stack construction, cell chemistry, electrolyte formulation, cell geometry, and housing material and likely can’t make changes to these factors without extensive development effort and validation. Process related factors, however, are more amenable to changes or tweaks in production to optimize performance or efficiency. Factors such as fill procedure, apparatus, or soaking temperature will have more direct and traceable impacts on the production process as a whole, making it possible for process engineers to quantify their effect on production quality. Without the right combination of product and process factors, cell manufacturers will end up with cells that are insufficiently saturated or large variations in cell saturation quality. Insufficient saturation quality leads to poor electrical performance and often defects that result in faulty or unsafe batteries.7
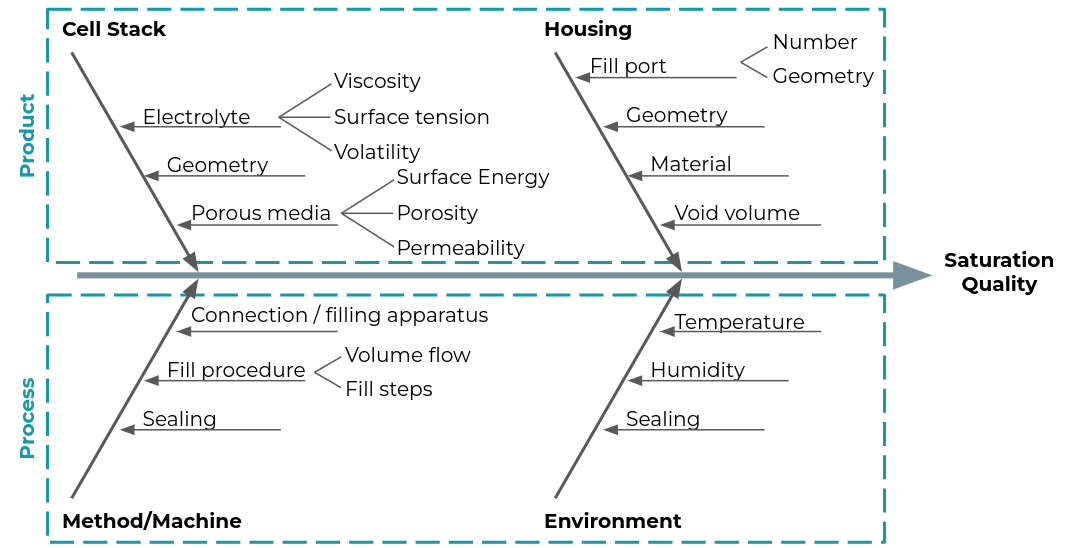
Figure 3: Ishikawa diagram of the different factors in manufacturing that impact cell saturation quality.
Electrolyte saturation behavior is well understood scientifically, but becomes much more difficult to asses in practice in a manufacturing environment. Understanding the most impactful factors for saturation quality can be difficult without access to quantitative information until after the process is finished. This results in fill and soak processes that can take anywhere from a day to over a week to complete, creating significant manufacturing bottlenecks. Time is wasted when systematic procedures are not set up to evaluate the quality of this process in real time. The industry goal to make batteries cheaper and more efficient will require bottlenecks, like fill and soak, to be reduced.7
The Information Gap Left by Incumbent Methods
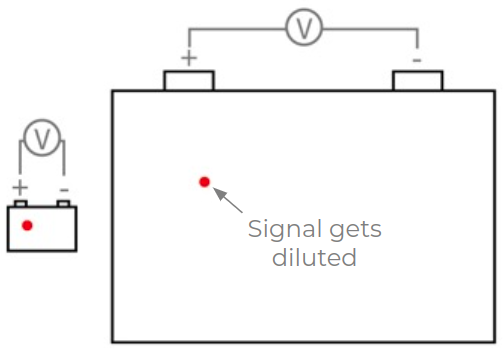
Figure 4: Electrical inspection methods become less sensitive as cells become larger.
Defects and anomalies can arise at each process step in cell manufacturing, the majority of which are not caught for days or weeks afterwards when standard electrical methods are used to determine the quality of a cell. For example, AC resistance or formation capacity can be used for a quick cell performance check earlier in the manufacturing process, but these are single-valued measurements that lose sensitivity to problems in larger cells (see Fig. 4). Other measurement methods like long-term cycling or capacity fade tests can detect the minor issues of a cell build, but are much slower requiring additional time and space to accommodate the tests.
As the industry scales to larger format cells, these generalized metrics will become less informative than what is needed to ensure safe and reliable batteries. The growing need for batteries in the EV and ESS market will require larger throughput but will need to maintain an extremely high degree of quality.6 The lack of unscalable and generalized measurement methods prove to be difficult as more control and optimization is required. While electrical methods are crucial for determining cell quality and providing insights in production, there remains a critical information gap that needs to be bridged. New, innovative technologies can be utilized in order to mitigate risks for manufacturers, scale new processes to appropriate levels, and ensure safe and performant batteries for end use customers.
The EchoStat® Advantage
Liminal has developed EchoStat, a solution platform that blends ultrasonic inspection and data analytics to provide quantitative metrics to be used in cell manufacturing. EchoStat uses ultrasonic transducers to send acoustic pulses at multiple positions to measure physical difference across the face of the cell. These pulses are transformed as they move through the cell and the resultant signal is recorded by a receiving transducer on the opposite face, which is then analyzed to deliver insightful information. Acoustic signals have distinct behaviors as they travel through different mediums (see Fig. 5. These signals can be impacted by the amount of liquid within a material, making ultrasound inspection directly applicable to distinguishing saturation quality within batteries. Since ultrasound is a physical measurement technique, this technology is chemistry, size, and form factor (pouch, prismatic, cylindrical) agnostic, making it robust and versatile. Furthermore, ultrasound tests can deliver spatially resolved information rapidly and non-destructively.
The EchoStat platform enables real time monitoring during steps of the cell manufacturing process that were previously not observable, making it a valuable tool for research, development, and production teams alike. EchoStat compliments current methods, while providing an avenue to obtain data earlier in the manufacturing process. The purpose of this study is to demonstrate how Liminal Insight’s technology is being used to advance the future of battery production.
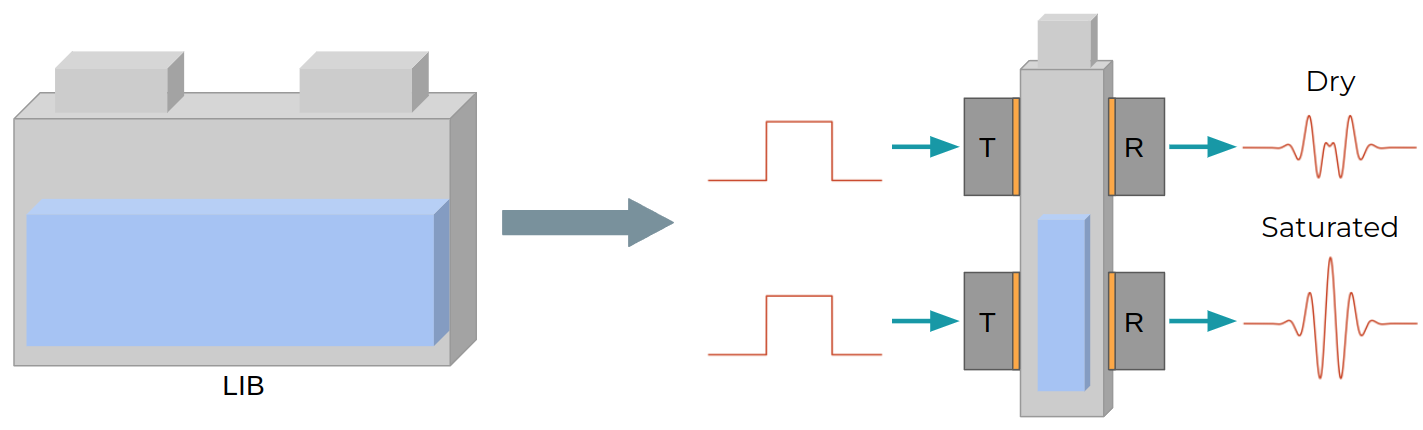
Figure 5: The principle of how EchoStat measurements work. Ultrasonic pulses are transmitted by a transducer (T) on one side of the cell, are altered by traveling through the cell material, and the resulting signals are recorded by another transducer (R) on the opposite side of the cell.
Case Study
We collaborated with a leading Li-metal cell manufacturer, to evaluate and improve on their existing fill and soak process. Our customer is—at the time of this evaluation—in the cell and process development phase as they begin commissioning their pilot line and ramp towards production scale volumes. As such, they were seeking a rapid, non-destructive, solution to aid in the development, optimization, and tracking of their processes to decrease cell development iteration times, increase production yield rates, and gain a deeper understanding of the physical phenomena that occur during cell fabrication operations. This evaluation seeks to address their needs while expanding evidence that Liminal’s EchoStat inspection platform: (1) is sensitive to changes in fill and soak protocols, (2) can be used for process optimization without compromising cell performance, and (3) provides meaningful metrics for in-process QC to determine electrolyte saturation quality before cells progress into formation.
EchoStat for Process Development
Cell manufacturer’s spend a great deal of time developing and optimizing their processes to maximize efficiency in their manufacturing lines and maintain cell performance without incurring unnecessary cost. Typically, these development efforts take a considerable amount of time for each new design as cells must go through long-term performance testing to be validated. Without the ability to observe the saturation process, the number of lengthy iteration rounds (or number of cells required) can increase substantially to find optimal conditions. This is why Liminal worked with a Li-metal cell manufacturer to compare two different electrolyte soaking protocols and investigate the impact they have on the quality of electrolyte saturation across the cell area in their developmental pouch cells. The two protocols were their standard soaking protocol (Protocol 1) and another where the cells were rolled with a fixed force at 10 evenly spaced time points throughout the soaking duration (Protocol 2).
Figure 6 presents Liminal’s proprietary wetting score — a key output from EchoStat — as a function of soak time for two cells, one each for the two soaking protocols. Here, time is presented as a fraction of the manufacturer’s nominal soak time for their production cells. For both protocols, cells were vacuum sealed after an initial period of soak (as indicated by the grey dash-dotted line). The dashed lines represent the predicted saturation curves for the cells based off of their measured wetting score values. Liminal’s saturation time model, uses the time progression of the wetting score to compute an estimate of when a cell has reached a steady level of saturation. These saturation time estimates are presented by the orange and teal dash-dotted lines in Fig. 6 for Protocol 1 and Protocol 2, respectively.
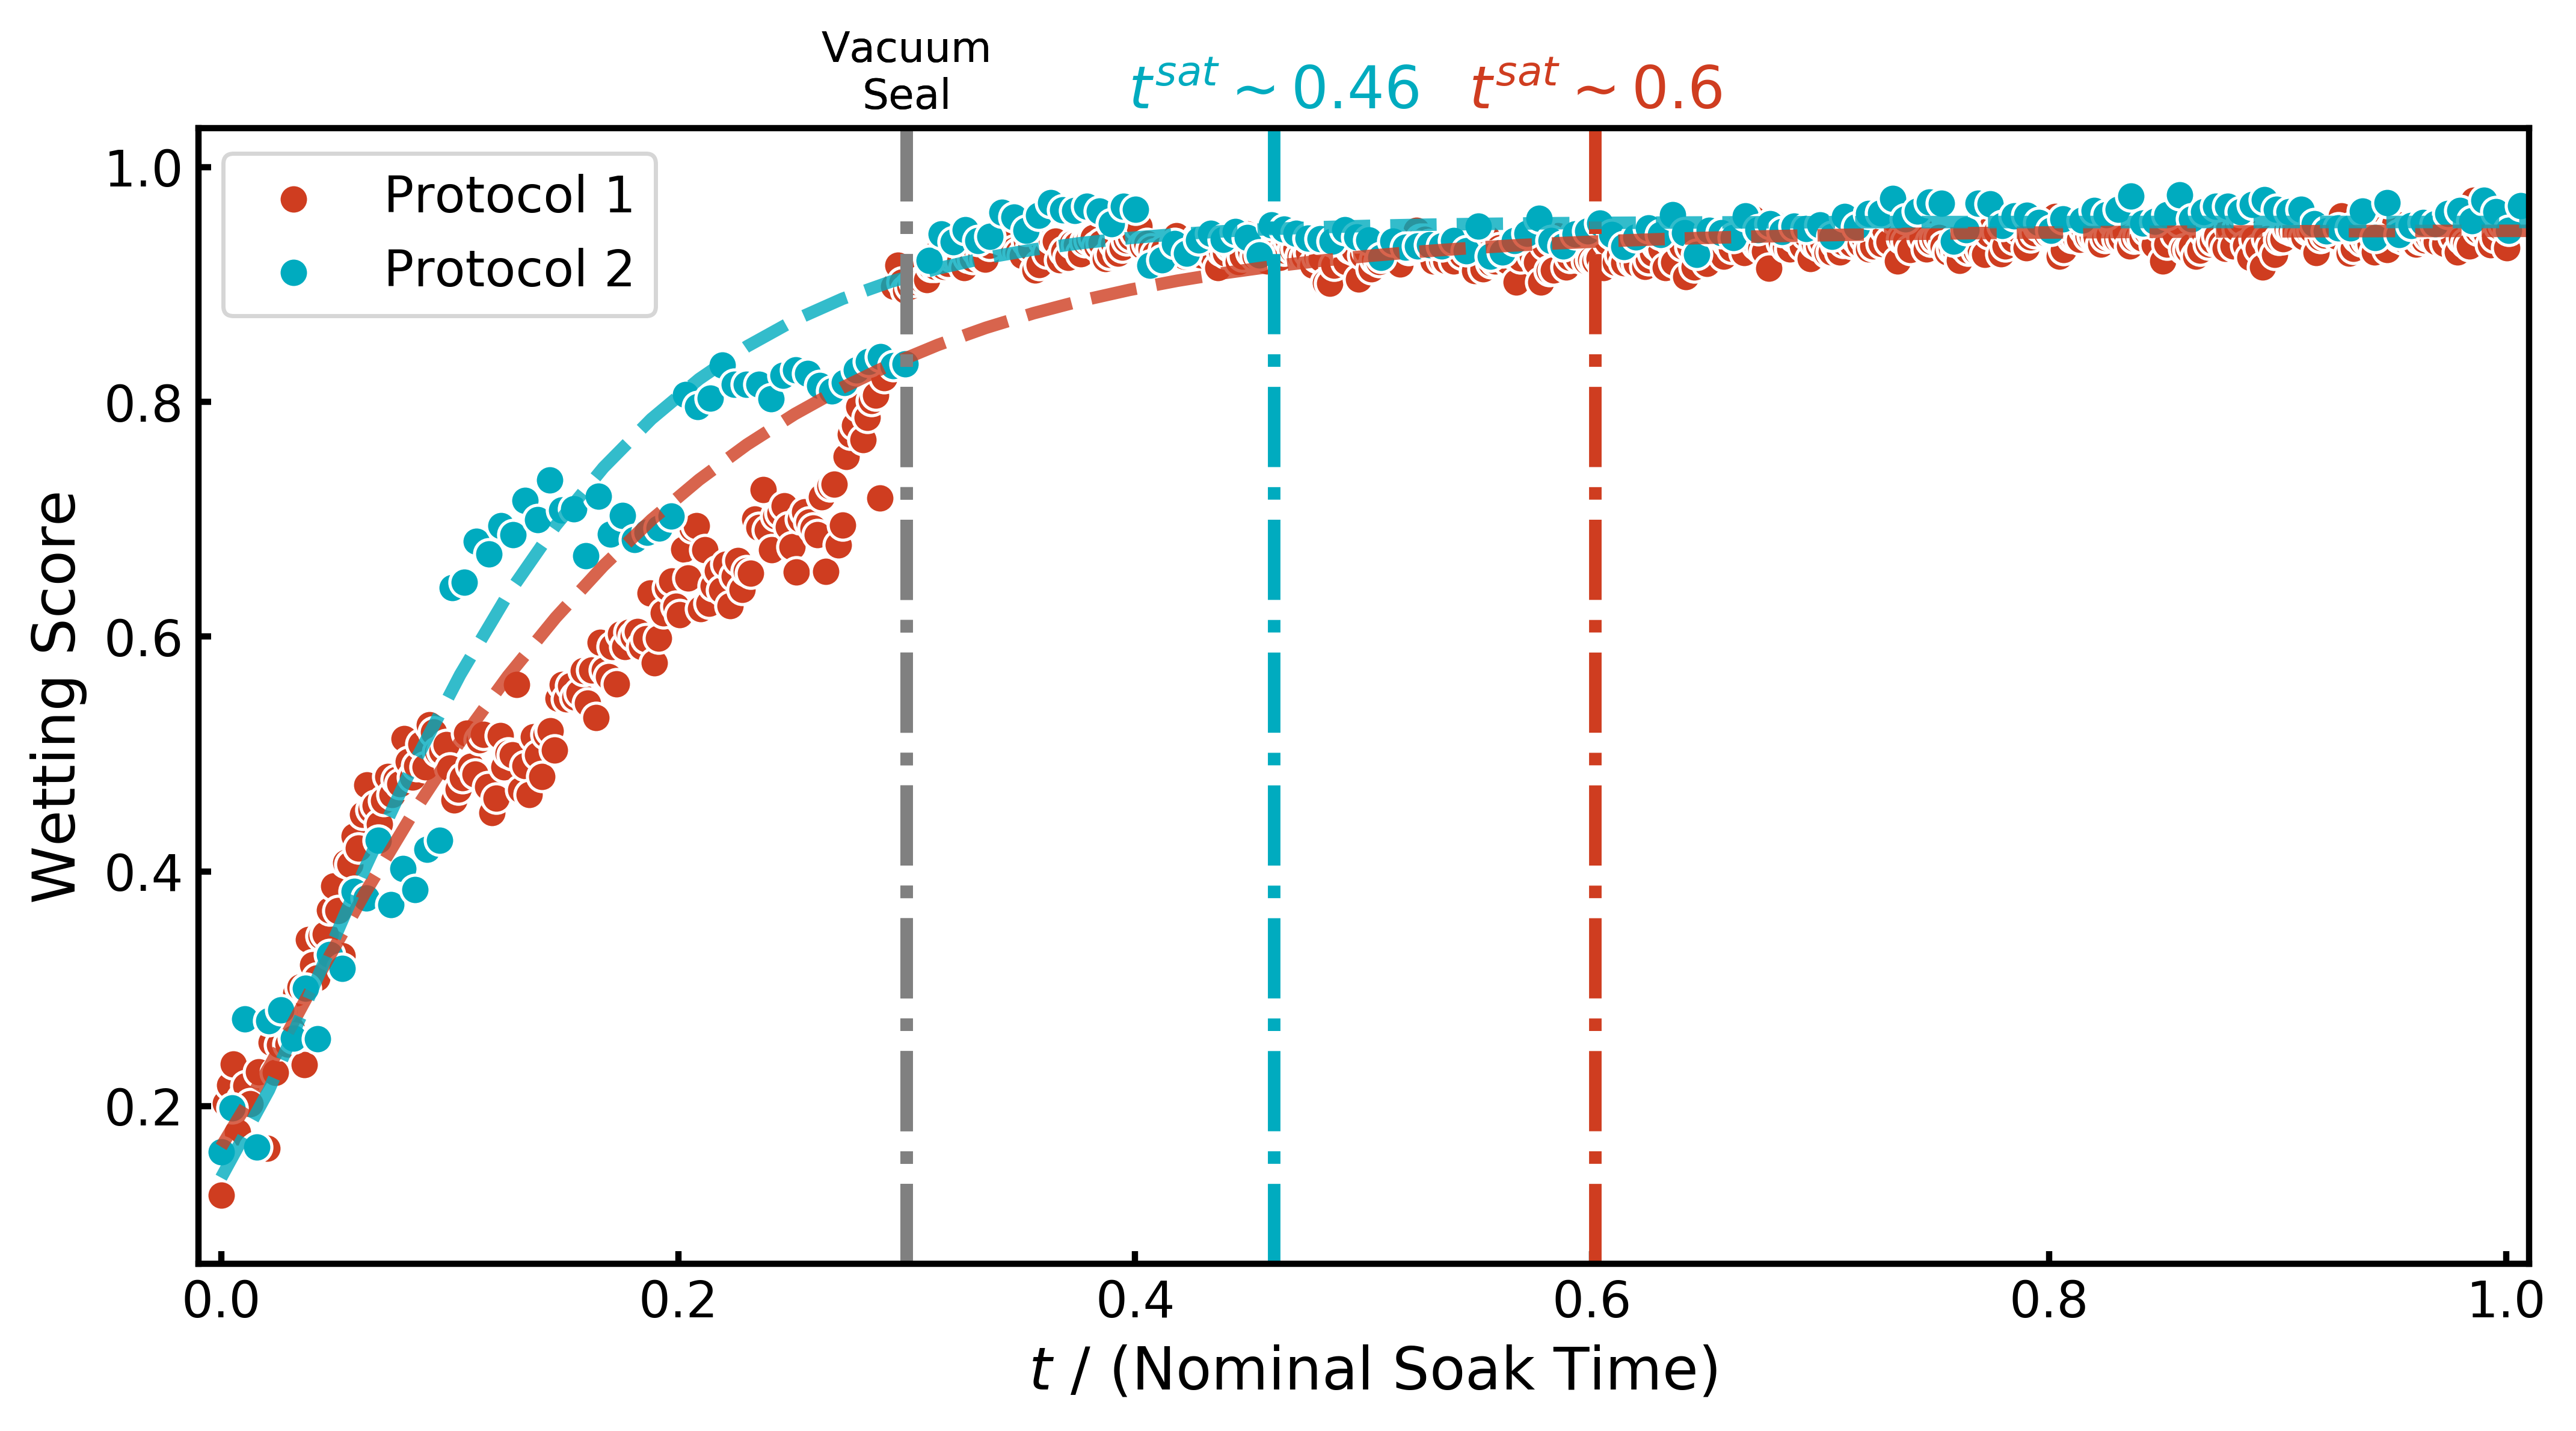
From this experiment it is clear that EchoStat is sensitive to changes in saturation progression brought about by different soaking protocols. We also see that physical manipulation of the cells accelerates the distribution of electrolyte, which matches our intuition. Rolling the cells can create an additional driving force that pushes electrolyte faster than it would move due to regular diffusion.
EchoStat for Process Optimization
To date, there is no way to rapidly track the quality or state of electrolyte soak within a cell before it goes into formation with incumbent methods. This obfuscation of the soaking process has historically resulted in cell manufacturers either having to perform a lengthy and detailed design of experiments (DOE) to optimize their process or continuing with a sub-optimal process that appears to meet performance standards. Often times the latter option is chosen, leading to longer build schedules and wasted time, all while still being unable to identify anomalies in the soak process that would lead to issues during or after formation.
With EchoStat, it is possible to more rapidly identify when the soaking process is complete without the need for an extensive DOE for a given soaking protocol. Using Liminal’s saturation time model, the cell manufacturer was able to identify when their cells were done soaking with their standard protocol (see the dash-dotted orange line in Fig. 6). The saturation model provides conservative and rigorous estimates for when cells have saturated, which were 60% and 50% of the original protocol’s soaking period, respectively.
To validate that no loss of performance was observed while using the suggested saturation times, the cell manufacturer had groups of cells, across two production batches, soak for four different lengths of time: 0.44, 0.5, 0.6, and 1.0 times the nominal duration before moving them into formation. Cells were then cycled to determine if there was a systematic drop in performance related to an abbreviated soaking duration. Figure 7 presents the cycling data for the different soaking duration groups for the two batches of cells. The symbols and error bars present the mean and 95% confidence intervals,9 respectively. The cycling performance metric of choice is the cycles to failure or to 90% capacity retention, whichever occurs first. Though this metric differs from the industry standard of 80% capacity retention, this cell manufacturer has undergone substantial effort internally to correlate the 90% and 80% capacity retention values in order to save both time and energy resources on long-term cycle testing. A main effects plot showing the impact of cell production batch on cell performance for cells that were allowed to soak the full nominal duration and the impact of soaking duration on cell performance are presented in the left and right halves of Fig. 8, respectively. From Figs. 7 and 8 we see that the conservative (0.6) and aggressive (0.5) soaking estimates from Liminal’s saturation model result in no significant change to overall cell performance. As a result of our evaluation, this cell manufacturer has reduced the soak duration for their pilot line production by 50% of the nominal value down to the more aggressive suggestion provided by our saturation time model.
EchoStat for In-process Quality Control
While the focus of this evaluation was primarily on EchoStat as a process development tool, Liminal is focused on creating solutions for in-line inspection and process control across production scales. One use of the wetting score output from an EchoStat scan is as an in-process quality control (IPQC) metric to evaluate how well a cell has soaked before it progresses to the next step in production. It should be noted that Liminal, as a company, does not seek to tell its customers how to control their processes, rather they create meaningful metrics that empower users to make informed, data-driven decisions around their processes.
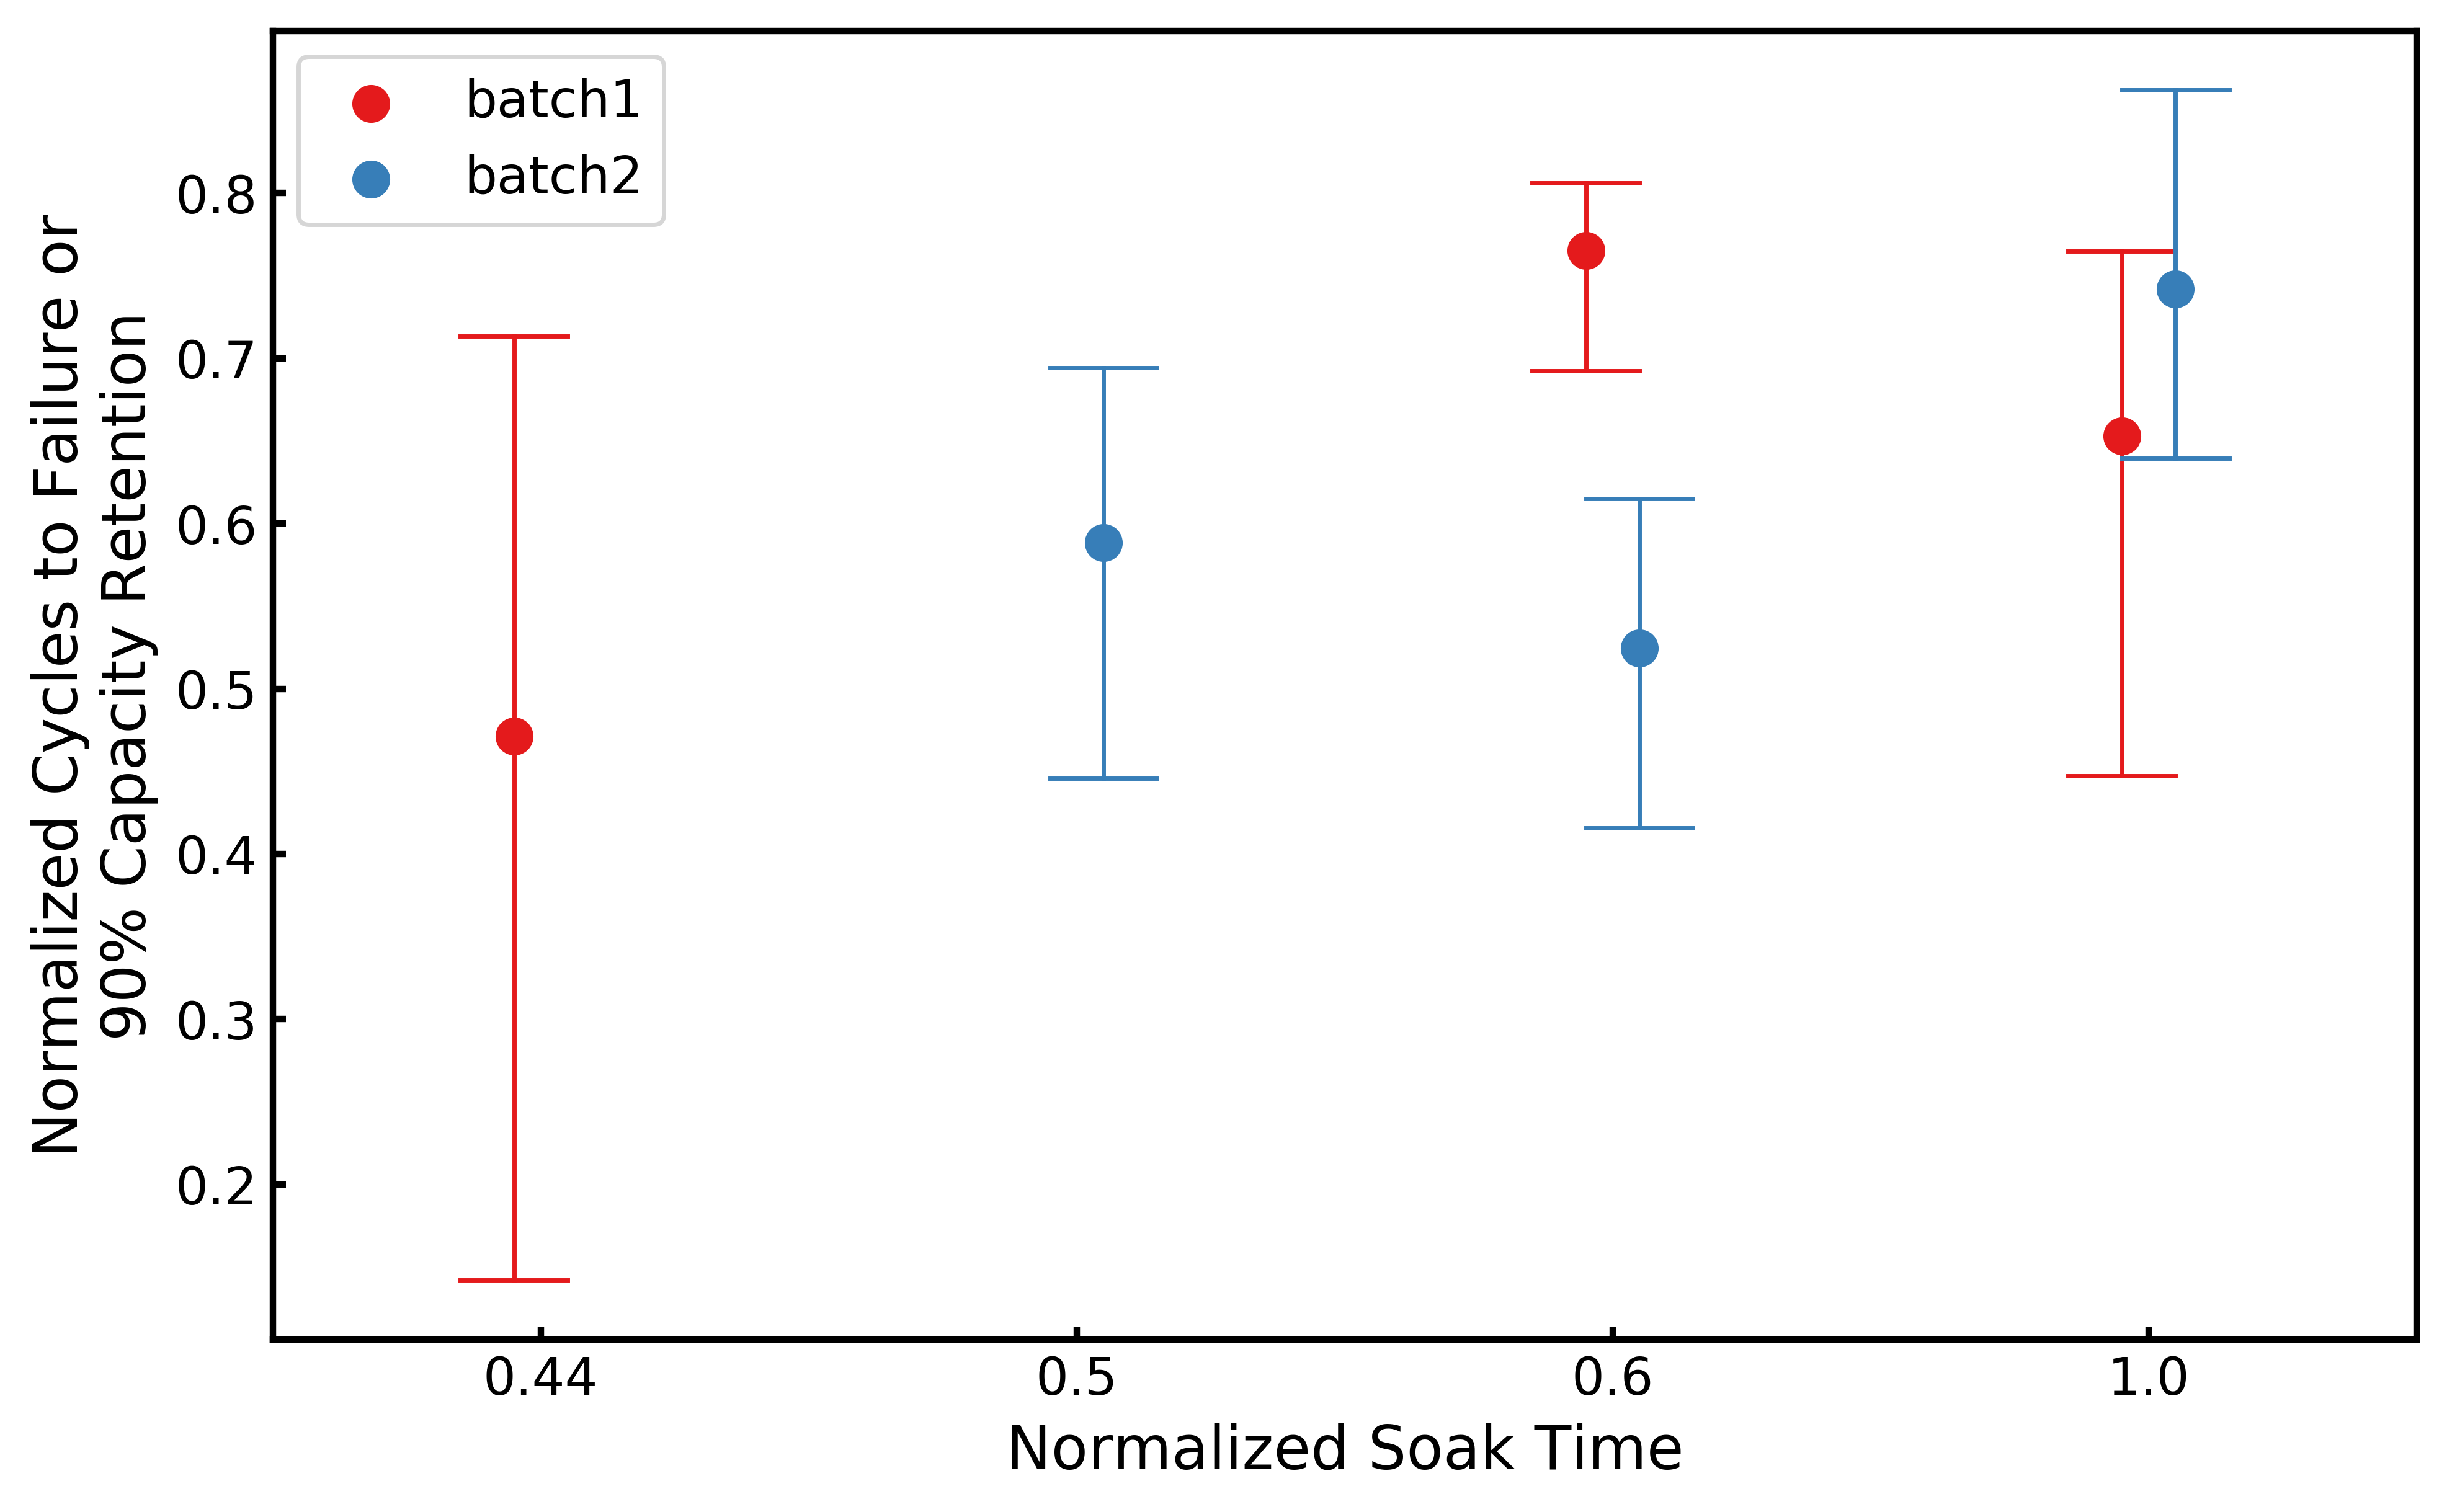
Figure 7: Average cycles to failure or 90% capacity retention for cells across two different production batches that underwent different lengths of soak time. Error bars represent the 95% confidence intervals.
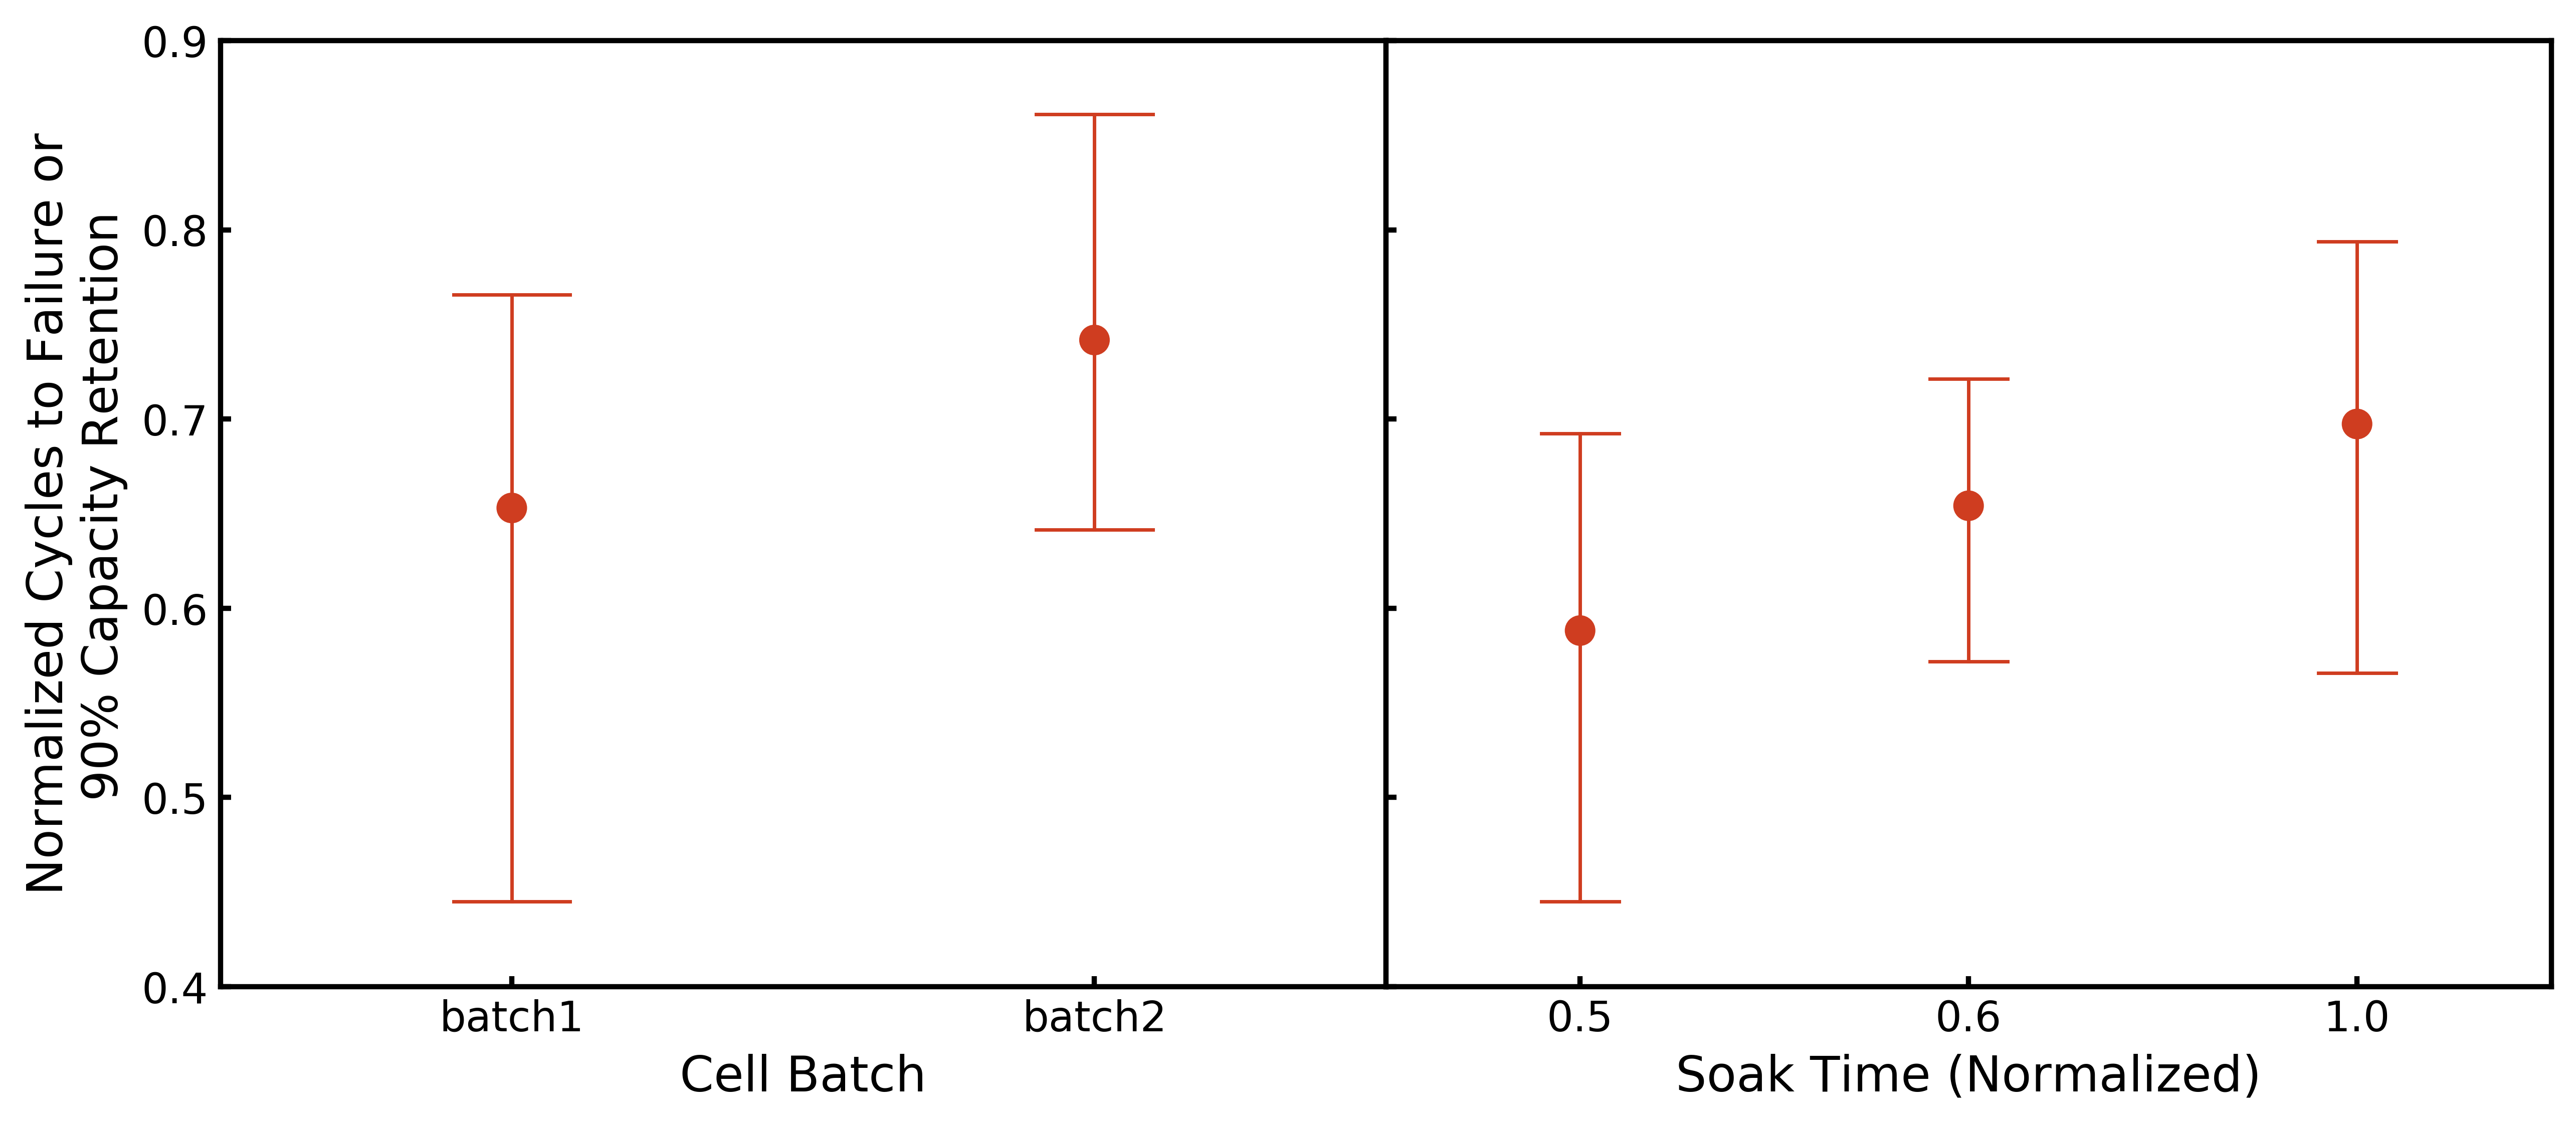
Figure 8: Main effects plots showing (left) the impact of production batch on cell performance for cells that were allowed to soak for the nominal duration and (right) the impact of soak time on cell performance regardless of production batch.
After the soaking process, cells can be measured with EchoStat to determine if sufficient electrolyte saturation has occurred before a cell continues on to the next step in manufacturing. A process control styled chart for the cells that went through the two soaking protocols outlined above in the process development section is presented in Fig. 9. Mock control limits are set at ±1.5 standard deviations away from the mean final wetting score value. With these control limits, we see that cells 037 and 044 (colored in orange) are outliers. Interestingly, both of these cells failed to successfully complete formation, indicating that the wetting score does provide value as an IPQC metric. By catching these outliers prior to formation, users now have the option to take corrective measures such as rolling the cells or allowing them to soak longer to encourage better saturation before moving them into formation. Preventing an ill-saturated cell from going into formation prevents time and resources being spent processing a cell that will have reduced performance or potentially fail during future processing steps and taking corrective action improves yield rates, minimizes material waste, and reduces scrap rates.
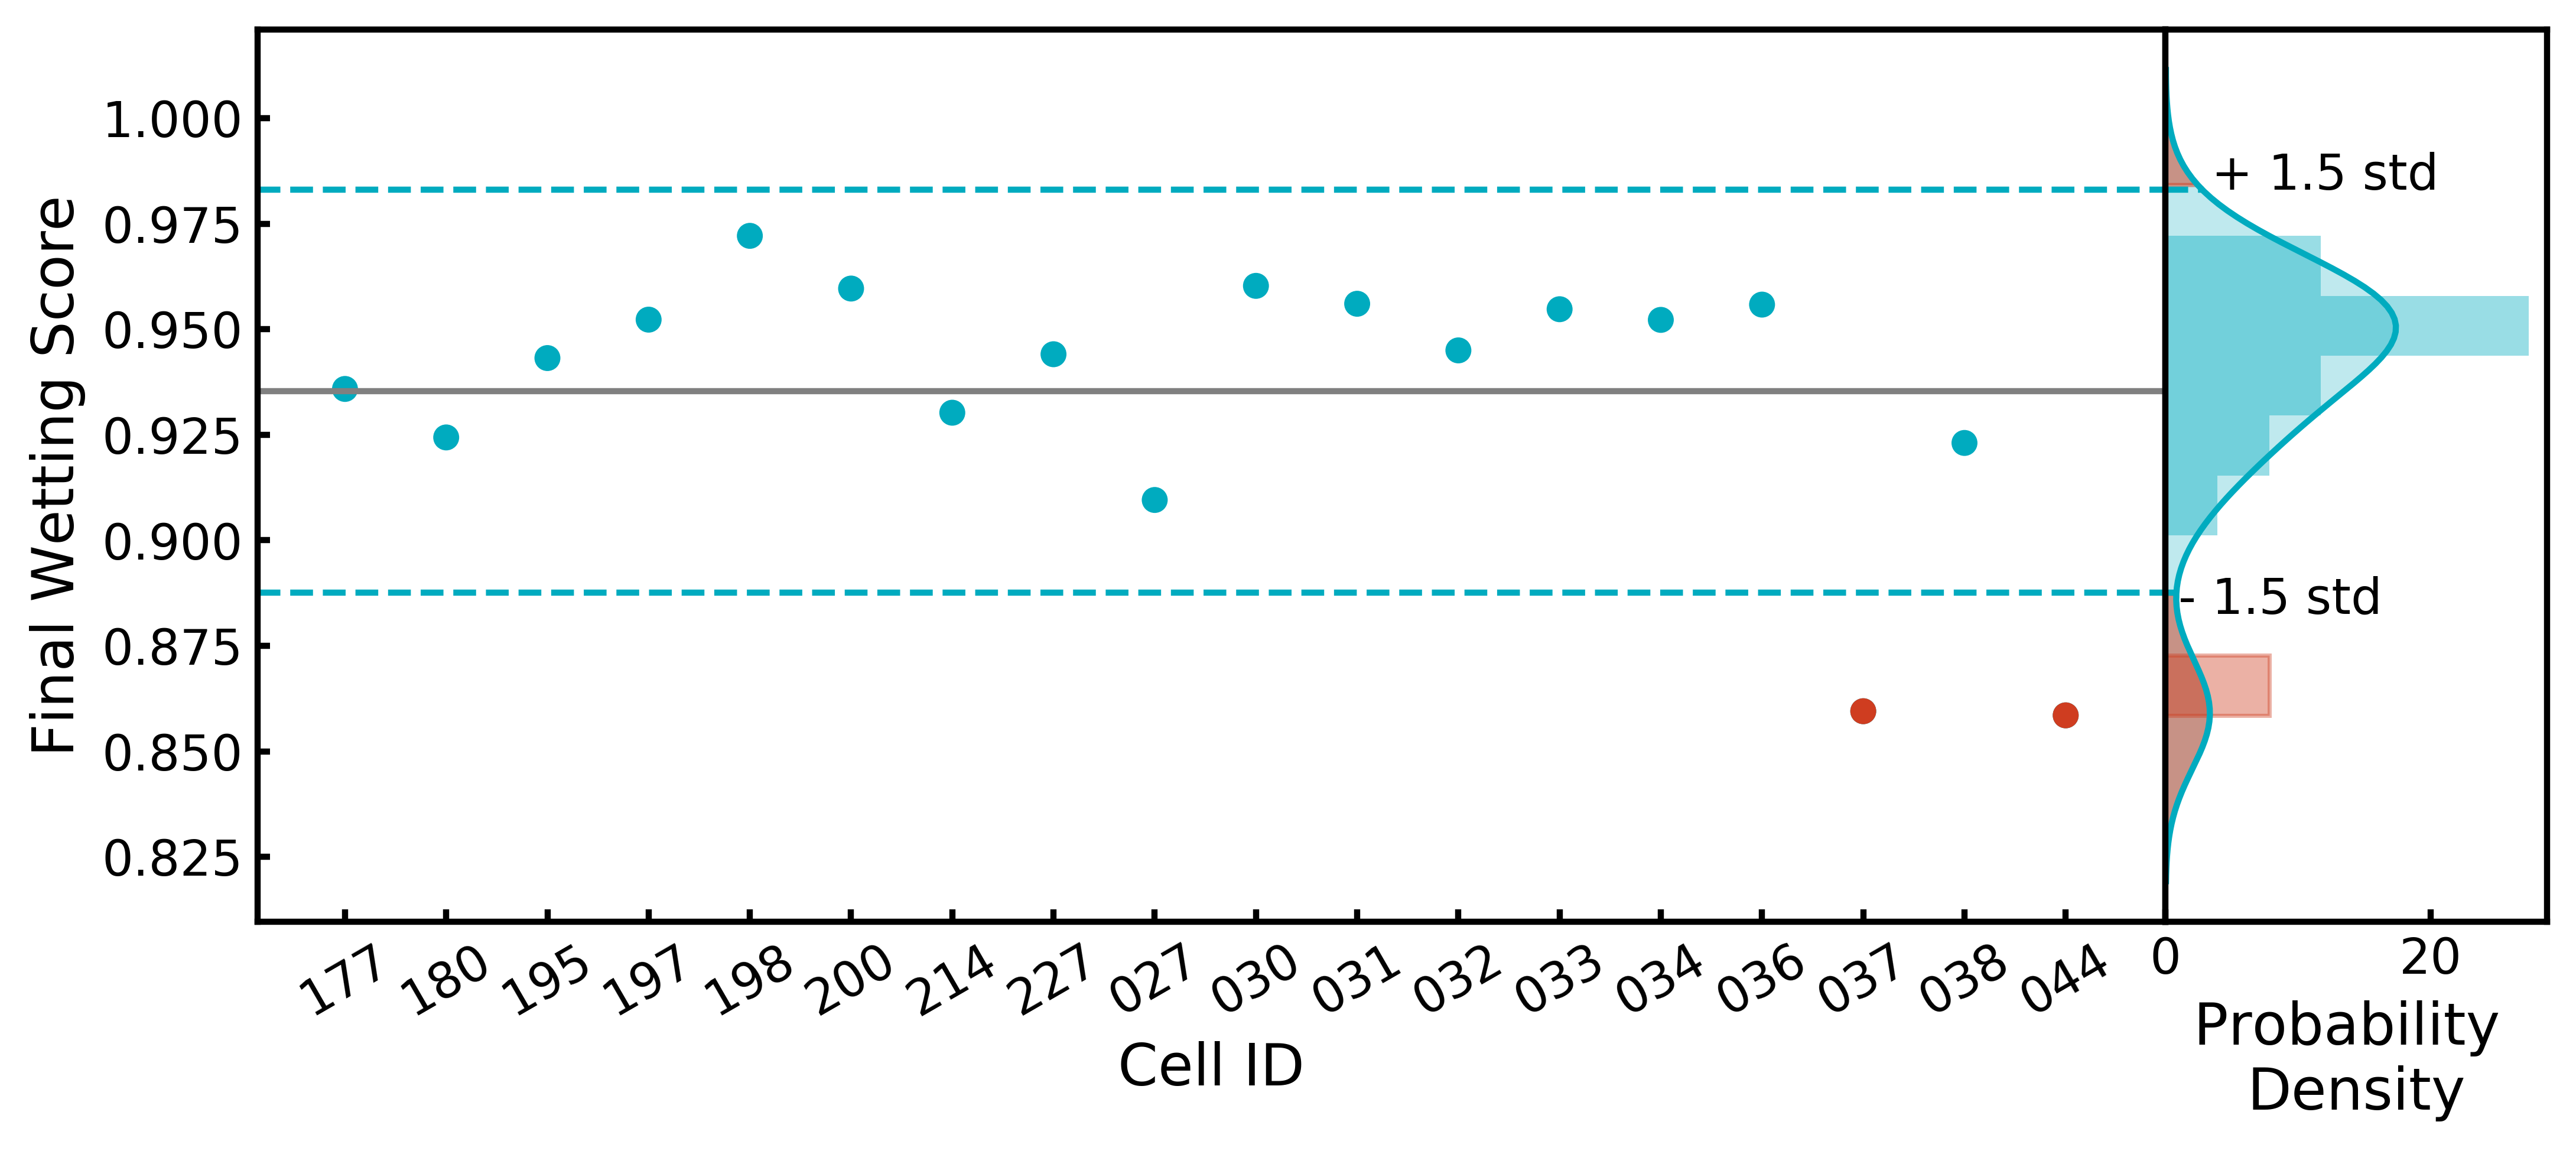
Figure 9: SPC chart of the final wetting score values. Dashed lines are the upper and lower control limits. The outlier cells (red) failed an internal post-formation QC check.
Concluding Remarks
In order to meet the growing energy demands, LIBs need to simultaneously increase in quality while continuing to drop in cell cost.2,5 Outside of commodity prices, manufacturing costs of LIBs contribute to, on average, 25% of a cell’s total cost.8 Cost reduction on manufacturing can be realized through reaching economies of scale, however further optimization of cost will require a rethinking of approach. Existing data needs to be leveraged and new data sources are necessary for manufacturers to continue to innovate on cost to enable affordable access to an electrified future.
Electrolyte fill and soak, for example, is a critical step during the manufacturing of LIBs that has, to this day, been treated as a hidden process that can only be evaluated after irreversible processing steps. Closing this information gap requires the adoption of novel, innovative technologies, like those offered by Liminal. We have shown that Liminal’s EchoStat solution is able to provide value in process development, process optimization, and IPQC for the electrolyte fill and soak process that has previously been either impossible or not scalable through to production scales.
Through this evaluation, this cell manufacturer has reduced the time required for their electrolyte soaking step by approximately 50% in their pilot line and has gained another metric to use during production to evaluate the quality and performance of their Li-metal pouch cells.
References
- Colin McKerracher, Aleksandra O’Donovan, Nick Albanese, Nikolas Soulopoulos, David Doherty, Milo Boers, Ryan Fisher, Corey Cantor, James Frith, Siyi Mi, Andrew Grant, Jinghong Lyu, Kwasi Ampofo, and Allen Abraham. EVO Report 2021 | BloombergNEF | Bloomberg Finance LP. Technical report, 2021.↩
- Nicolo Campagno, Alexander Pfeiffer, and Christer Tryggestad. Capturing the battery value-chain opportunity | McKinsey, 2022.↩
- Avicenne Energy. The Rechargeable Battery Market and Main Trends 2012-2025. 2013.↩
- Cairn Energy Research Advisors, Li-ion Battery Cell Manufacturing Cost Model and Analysis, 2021.↩
- Yeon Baik, Russell Hensley, Patrick Hertzke, and Stefan Knupfer. Making electric vehicles profitable | McKinsey, 2019.↩
- The Future of Battery Production for Electric Vehicles.↩
- Thomas Knoche, Florian Surek, and Gunter Reinhart. A Process Model for the Electrolyte Filling of Lithium-ion Batteries. In Procedia CIRP, volume 41, pages 405–410. Elsevier, 1 2016.↩
- James Frith. EV Battery Prices Risk Reversing Downward Trend as Metals Surge, 2021.↩
- Confidence intervals are computed from a 10,000 step bootstrapped sampling.↩