Eliminating Blind Spots in Electrolyte Saturation
Battery manufacturers face the challenge of scaling up production to meet skyrocketing demand while maintaining high quality and low prices. Cell quality can vary heavily—even within the same batch of source materials—and manufacturers are often blind to processing issues until QC testing is conducted weeks after production, or even years later, when costly recalls become necessary.
There is a pressing need for manufacturers to get real-time insights into their production processes and test every cell to ensure quality while scaling rapidly to meet demand. These types of challenges exist for cell makers in the R&D and pilot line stages, as well as those in high-volume production. Teams working on pilot lines may want to optimize saturation time to ensure lower costs as they scale up output. At high volume, quality teams want to know that every cell is properly saturated so that substandard cells don’t make it into vehicles.
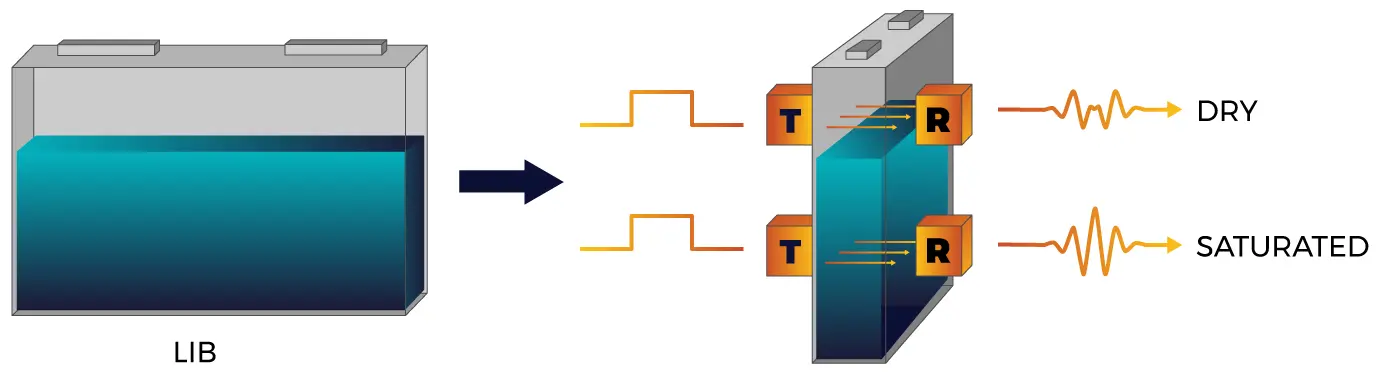
EV battery cell production consists of three broad steps: electrode manufacturing, cell assembly, and cell finishing. During electrolyte fill/soak process, the first step in cell finishing, the dry cell is filled with a predetermined quantity of electrolyte in a dry room with partial vacuum conditions to distribute electrolyte evenly within the entire cell volume. To date, the quality of this process is evaluated by weighing the cell before and immediately after filling to ensure that the proper amount of electrolyte was dispensed, which does not indicate the uniformity of electrolyte saturation. Current inspection methods are very limited after this stage: optical solutions cannot see inside the cell and x-rays are insensitive to low molecular weight materials, like electrolyte. Liminal’s cell inspection solution, EchoStat® fills that inspection gap in two ways:
- For process development: providing real-time information on degree of saturation to iterate on processes quickly and with the best information, helping R&D teams save time in scaling from pilot lines to production.
- For manufacturing: scanning every cell on a manufacturing line and providing a saturation analysis that can identify poorly soaked cells to improve processes and shift yield preformation.
The quality of electrolyte saturation can be affected by two main groups: those related to product and those related to process. Product-related factors include the components and assembly of the cell, such as the stack and housing. These factors are more tightly defined and less subject to iteration by the time a product is past the R&D stage. Process-related factors include the equipment used to inject electrolyte, production processes, and environmental factors in the dry room. From the pilot line to high volume production, processes can be changed, even incrementally, to optimize performance. These processes can be studied and measured to identify the best methods to maximize saturation quality in every cell.
Effects of poor saturation
Insufficient saturation quality leads to poor cycle life performance and often defects that result in faulty or unsafe batteries. As electric vehicles command a higher portion of global vehicle sales, automotive battery cells must increase in energy density by reducing the weight of inactive materials, like current collector foils, casing components, or separators per cell. This leads to larger format cells, which present unique challenges in production processes like electrolyte filling.
Manufacturers must ensure that all the cavities and pores of the electrodes and separators are sufficiently wetted before formation. If the electrolyte does not completely fill the pore space of electrodes and wet the active particles, a solid electrolyte interphase (SEI) layer will not grow uniformly on the active particle during the formation cycle, which can lead to electrolyte decomposition during cycling, lower Coulombic efficiency, or seed lithium dendrite formation.1 As a result, strong local layer thickness fluctuations can induce partial layer detachments and electrical resistance extremes that have a negative effect on the capacity and service life of the cell.
The increase in the number of layers, electrode thickness, and active material mass loading, combined with a decrease in surface area per cell decelerates the time-intensive wetting of the cell components with electrolyte even further. Filling, consisting of dosing and wetting steps, and formation, consisting of low rate cycling, present bottlenecks in the process chain with major impact on cell quality and therefore influence the productions costs of a cell.2
Since there is little insight into the cell at this stage, the duration for saturation is estimated using experience and validated later with cell tests; cell engineers need a quick, reliable method to measure saturation to help improve their processes. Variations in cell quality can affect a manufacturer’s confidence in their product and forces OEMs to account for this with oversized battery packs.
Insights provided by EchoStat
Liminal’s EchoStat cell inspection solution provides real-time monitoring during steps in the process that are not easily observable. In a six-second scan, EchoStat sends an ultrasonic signal through a cell, which provides vital information about its physical characteristics. This information correlates to the physical properties of the materials, along with the health of the battery, and helps identify many potential issues. EchoStat takes the raw acoustic data, extracts meaningful information and processes it using advanced physics-based machine learning analytics to deliver actionable insights in real-time.
With a quick scan, EchoStat can determine a cell’s saturation quality in real-time, allowing a manufacturer to take immediate action on poor quality cells. This can be useful for cell manufacturers in any stage:
1. Early stage process development: Ramp up and iterate faster
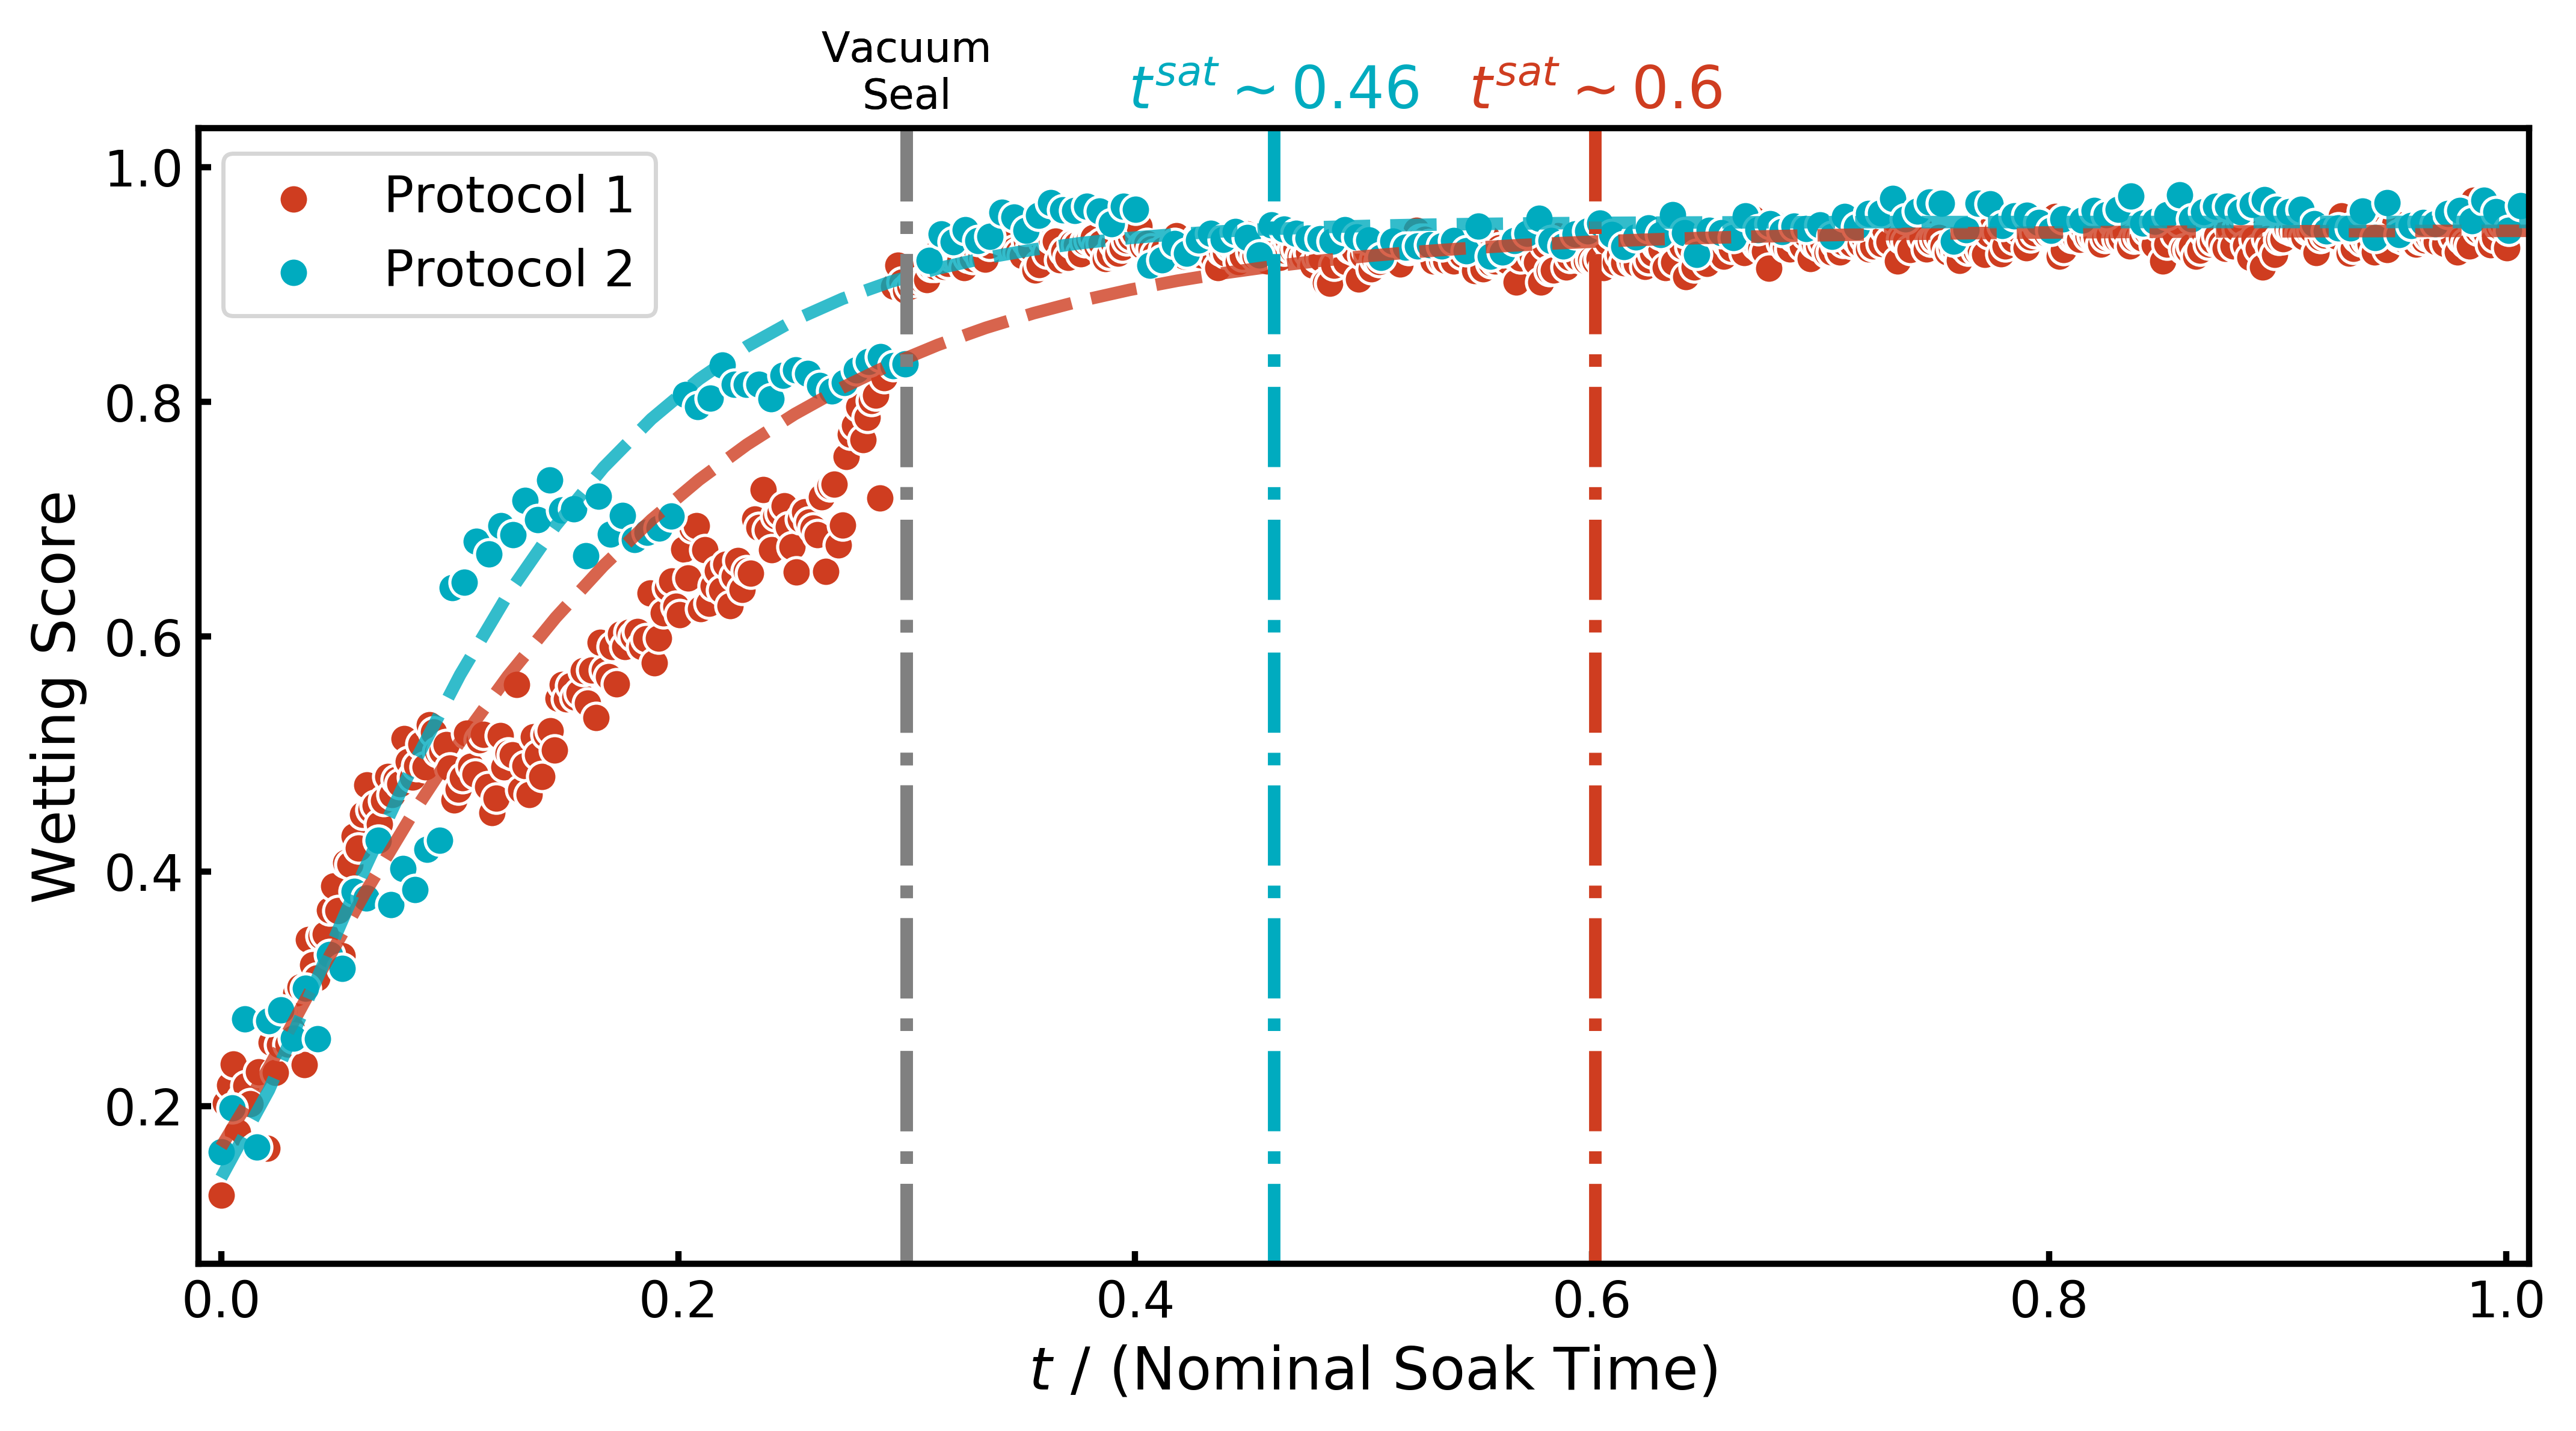
After filling, the cell must be stored for a certain period of time to ensure that the electrolyte is evenly distributed throughout the cell. Defining this period of time can be difficult as the saturation quality is unobservable. Without the ability to monitor the electrolyte soaking process with real-time data, battery scientists have to wait for the cells to go through formation and performance cycling before they have information on time-to-saturation and cell quality. Scientists might repeat this lengthy process until they determine an optimal soak time. EchoStat can help determine actual saturation time and electrolyte distribution quality in real-time to close this time-to-information loop and reduce this bottleneck in process development. In a previous engagement with a customer’s pilot line, EchoStat was able to cut soaking time by 50% with no loss in performance, measured through cycling data.
2. High volume manufacturing: Process and quality control
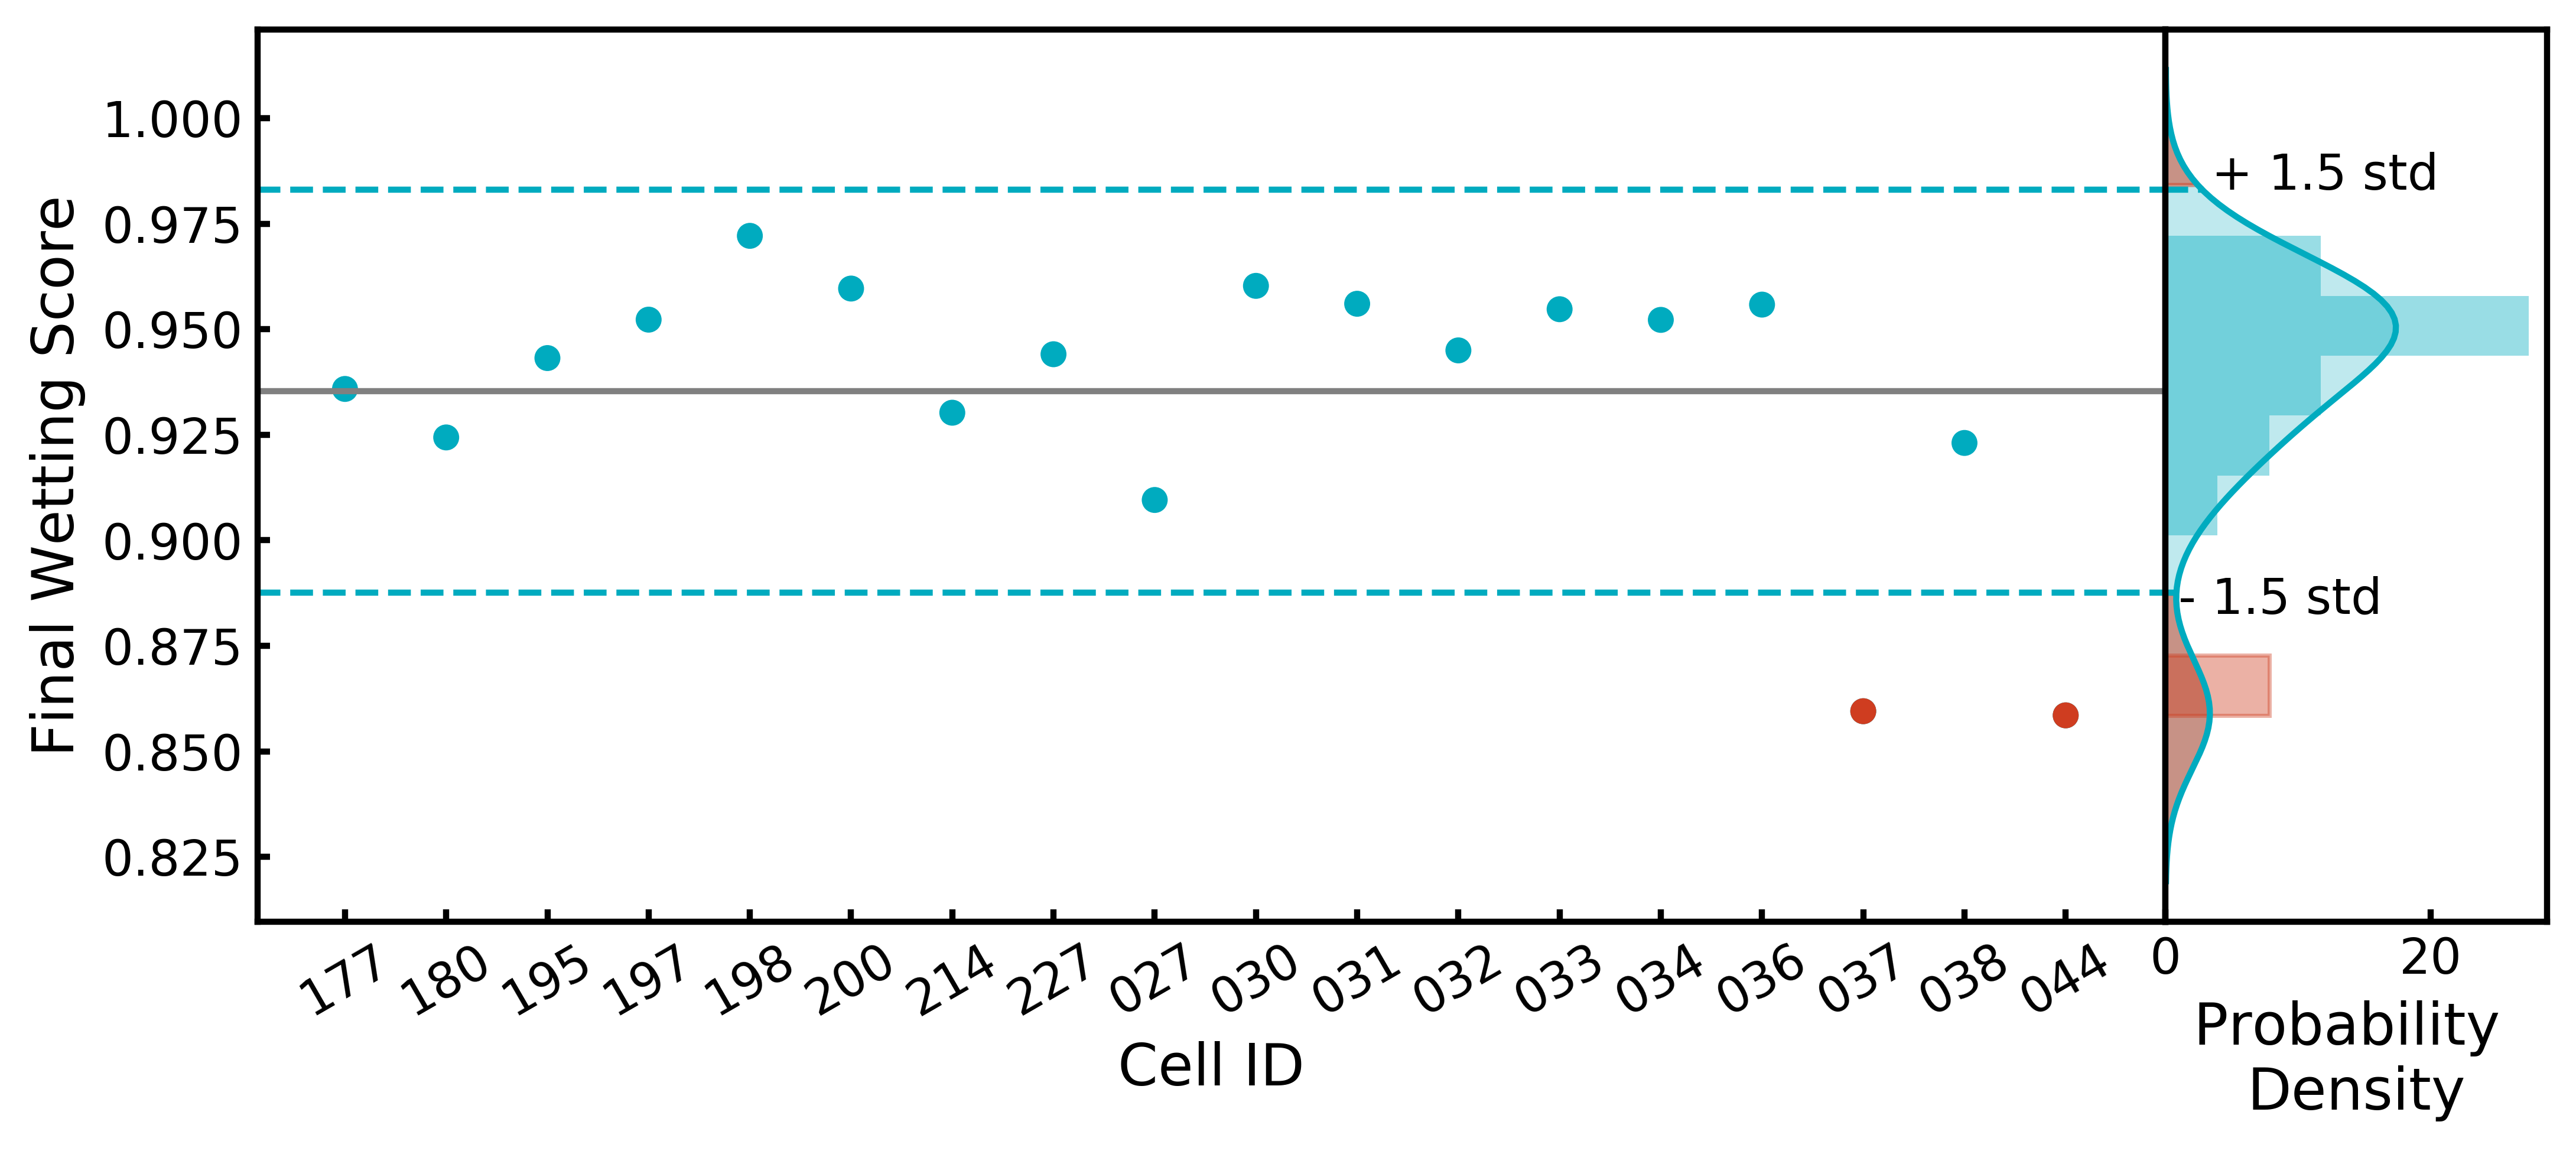
In high volume production, EchoStat ARRAY is an automated, factory-ready inspection system that can scan cells at 10 parts per minute; multiple systems can be combined together to meet factory block output. EchoStat ARRAY can quickly and accurately estimate electrolyte saturation quality with a nondestructive test. In a Gigafactory, identifying and removing poorly soaked cells before moving them to formation can save time, cost, and energy by preventing suspect cells from going through downstream steps. This can also improve end-of-line yield, resulting in higher confidence that quality cells are being installed in electric vehicles. Additionally, by analyzing data at the process line or factory level, Liminal can help identify quality metric trends before they become major issues. This would allow manufacturers to build predictive models that can influence process-equipment maintenance schedules based on process drifts and cell quality. With access to new information in real-time, cell makers can make informed, data-driven decisions around their processes.
The Result
With saturation analysis, EchoStat can significantly reduce the time required for the electrolyte-soaking step and evaluate cells during production to improve end of line yield. This saves valuable time and costs, both in development and in steady state production. EchoStat’s saturation analysis can close an information gap that could only be evaluated after several costly and irreversible processing steps.
With access to new metrics, it becomes possible to identify potential issues in advance, allowing proactive corrections to be made. This approach significantly enhances product quality and simultaneously reduces the rate of scrap, contributing to more efficient and effective manufacturing processes. Liminal works with customers to improve their processes, quality, and margins. with information-rich data previously unavailable to cell manufacturers.
References
1Christina Sauter et al 2020. J. Electrochem. Soc. 167 100546
https://iopscience.iop.org/article/10.1149/1945-7111/ab9bfd#:~:text=First%2C%20if%20the%20electrolyte%20does,cycling%2C%20lower%20Coulombic%20efficiency%2C%20or↩︎
2Florian J. Gunter et al 2018. Journal of The Electrochemical Society, 165 (14) A3249-A3256 (2018)
https://drive.google.com/file/d/19mW_BKPuh3GQApschSZe0Zn0Og4aGEMc/view↩︎
3Austin R. Dulaney et al 2022. Liminal Insights
https://www.liminalinsights.com/white-papers/technical-white-paper/